
The people of Utrecht are very satisfied with cycling in their city and they continue to cycle more every year. Cycling increased with five percent last year, while the number of car trips in the city remained the same. Since, however, the population is growing rapidly, car use in Utrecht decreased relatively. These new figures were published earlier this month by the city of Utrecht.
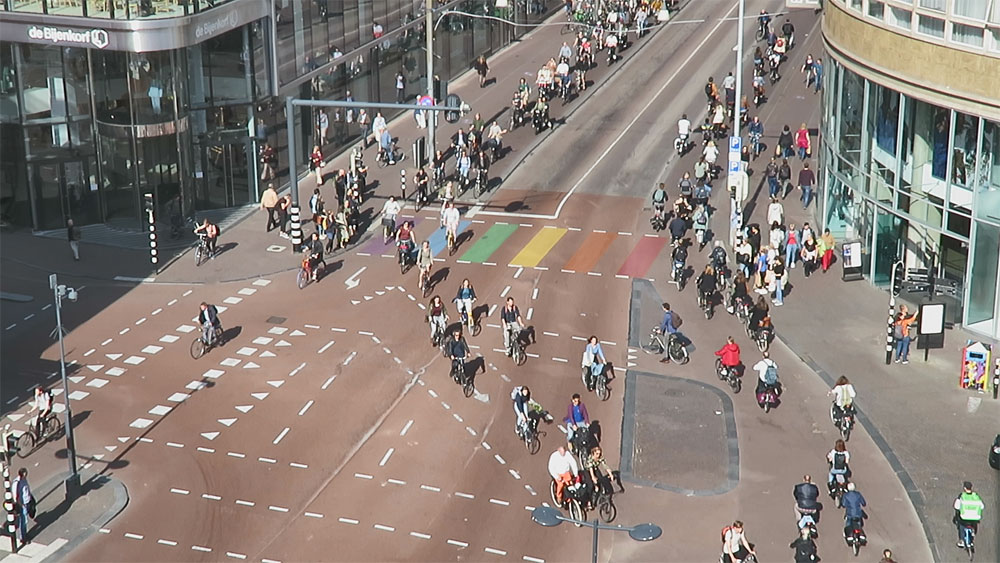
In a city where 96 percent of all 352,941 residents own at least one bicycle, which they use for 60 percent of all trips to visit the city centre, it is not so strange that you can watch an intersection in that city centre and see a lot of cycling. Almost exactly five years ago I had shown you the intersection at the edge of the Vredenburg square from above, filmed from an office building. The street was being reconstructed at the time. Clarence Eckerson from StreetFilms in New York visited Utrecht last week and I showed him a bit of Utrecht one afternoon, together with Rebecca Albrecht and Paul Larrabee, Americans who live in Utrecht for about two years now. The four of us even got “stuck” (for all of at least 2 minutes) in a cycle traffic jam. A day later Clarence went up to the second floor of a department store and filmed this very intersection – which is now finished obviously – from a restaurant window. The short clip drew a lot of attention, including from someone who lives in an apartment on the other side of the street. He has a view on the same place from his balcony (so no glass in the way!) and as an answer he posted his own clip on Twitter. I immediately jumped in, because I knew there are images of this intersection from almost that same location from 1968 and I saw potential for a video comparing the situations. Long story short: I was very kindly invited to film from the 5th floor balcony of one of my followers. Clarence was also welcome to do that, had he not already been in Amsterdam to interview people on his last day of this year’s Netherlands trip.

There are no private cars allowed in this particular street. It has been like this since 1996. From then on this street has grown to become the busiest cycleway in the Netherlands. Before it was closed to private motor traffic this was the main east-west corridor through the city. I published a post about the history of this corridor long ago already. Motor traffic now needs to go around the core of the city centre. In most other places cars are allowed and the people in Utrecht do use their cars. While the ownership of bicycles is 96 percent per person (or 2.9 bicycles per household), car ownership remained stable at the much lower percentage of 68 percent per household. People living in the 32 percent of households which do not own a car may cycle, but car sharing is also becoming more common in Utrecht. The number of shared cars increased by 31% to over 3,300, which means that Utrecht has the highest car share percentage per capita in the Netherlands. The number of private electric cars increased as well with 88% to 3,800 vehicles. There is a total of 5,250 electric vehicles in Utrecht, which is about 3% of the total number of vehicles. In 2018, a lot of people came to Utrecht by car but they used one of the four parking lots at the edge of the city to then go to the city centre by public transport. The city sold well over 210,000 tickets for this system last year. While the amount of car trips has remained the same in absolute numbers, car use decreased relatively because the number of residents is increasing considerably in Utrecht, which is the fastest growing city in the Netherlands.


These new figures can all be found in the Mobility Monitor 2019 that the municipality of Utrecht published on 8 May 2019. The city uses this annual survey together with permanently installed traffic counters to monitor its mobility policies. With these policies the city aims to contribute to a healthy, safe and attractive city. One of the main points is to reduce the amount of through motor traffic from the city streets by making them less attractive to through traffic. I have given you a few examples of that before, most noteworthy the reconstructions of Paardenveld, ‘t Goylaan and Croeselaan. However, the city is not completely satisfied yet with the results of such projects. The amount of through traffic on urban connecting roads is still considerable with more than 40 percent on average. Floating car data shows (among other sources) that also, on average, more than 30 percent of road users do not choose the nearest approach road to leave or enter the city. This means that there is still more through traffic in the city streets than necessary. Therefore, the municipality will keep working on measures to further limit through traffic to ensure a better living environment for residents. Fewer cars will mean decreased levels of air pollution and noise and also that Utrecht will be better able to reach its goal to create a liveable and accessible city.

Let’s zoom in on how happy the people in Utrecht are with cycling. The bicycle is the most commonly used mode of transport within the city: 47 percent of the residents take the bicycle to a destination within Utrecht. Especially for visits to the city centre the bicycle has been the most popular means of transport for years. In the past year, the popularity of the bicycle increased slightly. In 2018, 60 percent of all Utrecht residents usually went by bike to the city centre. In 2017 this was 58 percent. Especially from Leidsche Rijn (51%) the bicycle was used more often in the past year than in 2017 (43%). People from that new part of the city seemed to have found the Dafne Schippersbrug, which will mostly offer them the shortest route to the city centre. The residents living east of the city centre use the bicycle most often when visiting that city centre (80%). Among the residents of the city centre itself (31%) and Vleuten-De Meern (30%), the bicycle is least popular to do this. Not surprisingly, 66% of city centre residents walk the short distance. People from Vleuten-De Meern (for which the distance to the centre is longest of all neighbourhoods) most often choose public transport (57%).
Utrecht residents are generally positive about the cycle paths in their own neighbourhood (70%), with some variations in the different parts of the city. Residents of the inner city are least enthusiastic about the cycle paths in their neighbourhood (55% is satisfied). This could very well have to do with how busy those cycleways are in the centre. Residents of Vleuten-De Meern (79%) and Leidsche Rijn (84%) are relatively often pleased with their local cycleways. There are also downsides to the success of cycling. One in five people in Utrecht (19%) say they are often annoyed by parked bicycles near their homes. This is primarily considered a problem in the city centre (38%). In Leidsche Rijn (7%) and Vleuten-De Meern (4%), parked bicycles in the residential streets are clearly less challenging than in the rest of Utrecht.

In the city centre there are more challenges regarding bicycle parking. While in 2017 79 percent of the people in Utrecht were positive about the bicycle parking facilities (excluding the station), in 2018 this percentage decreased to 74 percent. When it comes to parking at the central railway station the figures are better. No less than 85 percent of the Utrecht residents state that they are satisfied with the guarded bicycle parking facilities there. This is a slight increase compared to 2017 (82%). The number of bicycle parking places increased considerably in 2018 with the opening of the third big facility in April.
Traffic safety in Utrecht is slightly improving. The number of recorded crashes on the city’s streets dropped by 8% (with 156) to 1,926 in 2018. This decrease is relatively larger than the average decrease for the country and especially than the other larger cities. A total of 107 fewer people were injured in 2018. The number of traffic fatalities (for all types of traffic combined) is so low that it fluctuates considerably, in the past 5 years between 3 and 7. (2018, 7; 2017, 3; 2016, 7; 2015, 7; 2014, 4)
Finally there is some good news about the intersection in the video. The Utrecht alderman for traffic replied to my tweet that she was pleased to announce that the traffic light phases of this intersection (and some others) had been reviewed that week. She joked that the “stop-light guys” were able to find a few more seconds in the cycles at this intersection, that could be added to the green time for cycling. Which is excellent news!
Enjoy the view!
This week’s video: a look at the intersection of
Vredenburg/Lange Viestraat/Sint Jacobsstraat
filmed during the evening rush hour on Thursday 23 May 2019.
All figures from the transport monitor can be found (in Dutch) on the city’s website.

Great post, Mark. Very informative text and spliced videos. 1968 just looks so crazy for a Dutch city, just so hard to imagine it was ever like that ie like every city in Australia still is.
Would like to know more about how the Utrecht municipality got around with the legal requirement for white zebra crossing and made the rainbow crossing permanent, looking forward with thanks 🙂
As I explain in the post: the rainbow crossing is not a zebra crossing. It is a crossing without priority and those only require white dashed lines on the outside of the crossing. If you look at the rainbow crossing you can see those white dashed lines on the outside. The law doesn’t state that you cannot have bright colours in between, so the crossing is a legal crossing, just not a zebra.
Utrecht doesn’t combine zebra crossings with traffic lights because of conflicting priority rules. Namely: when you have a red light you don’t have priority as a pedestrian and with a green light you do? That is not clear enough. Especially since you already have a free road with a green light anyway. But other municipalities do combine zebra’s with lights, so that is also confusing…
Its a bit a pity that also the modal split for walking decreased. And there probably is a strong competition between public transport and cycling. Rental bikes like Swapfiets are immensely popular amidst students.
Very cool article! Would you be interested in posting a shorter version of it on a new English language website we’re creating called The Utrecht Hub?